Evaluating Local LLMs on Network Tasks: The Right Tool (Part 1)
Six local LLMs tested against five real network lab tasks. A baseline cold start run exposing the gap between assumed hardware capability and actual execution.


Cold Start
The question driving this test was not academic. An autonomous network lab running SR Linux on containerlab requires specific capabilities. It needs to triage BGP events in real time, interpret telemetry, generate topology configs, and write post-session technical summaries. These are the actual tasks. The question was: which local models can handle them, at what cost, and where does each one belong in the system?
The Hardware
Dell Precision 3571. Intel Core i7-12700H: 6 P-cores, 8 E-cores, 20 threads. 16GB DDR5. NVIDIA T600 4GB VRAM.
The plan was to characterize models against this memory envelope: which fit inside 4GB VRAM, which spill to system RAM, and what that costs in throughput. A 3.8B or 4B model at 4-bit quantization fits inside the T600. A 7B or above does not. The plan was to capture the performance cliff.
The reality was different. I'll get to that.
The Models
I wasn't looking for the most capable model in isolation. I was looking for what actually runs on this hardware, within this VRAM envelope, at usable latency for a voice loop.
| Model | Parameters | Expected Resource Use |
|---|---|---|
| Phi-3.5 Mini | 3.8B | Full VRAM |
| Gemma 3 4B | 4.0B | Full VRAM |
| Qwen 2.5 Coder 7B | 7.0B | CPU spill |
| Llama 3.1 8B | 8.0B | CPU spill |
| Gemma 3 12B | 12.0B | Heavy CPU spill |
| Claude Haiku 4.5 | N/A | API / Cloud |
Claude Haiku 4.5 is the calibration baseline. If a local model can match it on these tasks, it earns its place in the architecture. If not, that's also useful information.
Haiku is not here to win. It's here to define what "good enough" looks like.
The Tasks
Five tasks. All derived from actual lab operations. Not benchmarking conventions.
T1: Structured Data Summarization
A raw table of BGP session metrics. Uptime, prefix counts, reset counts, state flags. Generate a plain-English summary for an ops handoff. Identify any breach condition in the data.
The failure mode here is specific: does the model report what the data says, or does it generate a plausible-sounding narrative that contradicts the data?
T2: BGP Event Triage
A sequence of BGP log events across multiple peers. Classify each event. Identify the most likely root cause. Recommend an action.
The data contains the answer. The question is whether the model finds it or invents one.
T3: Containerlab Topology Generation
Generate a valid containerlab YAML topology: 13 nodes, 8 links, SR Linux images, specific naming conventions. Auto-validated on three checks: YAML validity, node count, link count.
This is the hardest task in the set. It requires structural precision (valid YAML), semantic accuracy (correct node and link definitions), and domain knowledge of the containerlab schema. There's no partial credit. A topology with 13 nodes but broken link syntax doesn't deploy.
T4: React NodeStatus Component
Write a functional React component that displays node status for a network element. Auto-checked for JSX structure including export default.
The lab visualizer is a production system. This isn't a toy task.
T5: Python gNMI BGP Poller
Write a Python script that uses gNMI to poll BGP neighbor state from an SR Linux node. Auto-checked for valid Python syntax.
This mirrors code running in the lab now.
What Happened
Auto-checks came back before I'd read all the outputs.
T3 separated the field.
| Model | YAML Valid | Nodes (13) | Links (8) |
|---|---|---|---|
| Phi-3.5 Mini | FAIL | — | — |
| Gemma 3 4B | PASS | FAIL (0) | FAIL (0) |
| Qwen 2.5 Coder 7B | PASS | PASS | PASS |
| Llama 3.1 8B | PASS | FAIL (0) | FAIL (0) |
| Gemma 3 12B | TIMEOUT | — | — |
| Claude Haiku 4.5 | PASS | PASS | PASS |
The failure modes are not equivalent, and they matter for routing decisions:
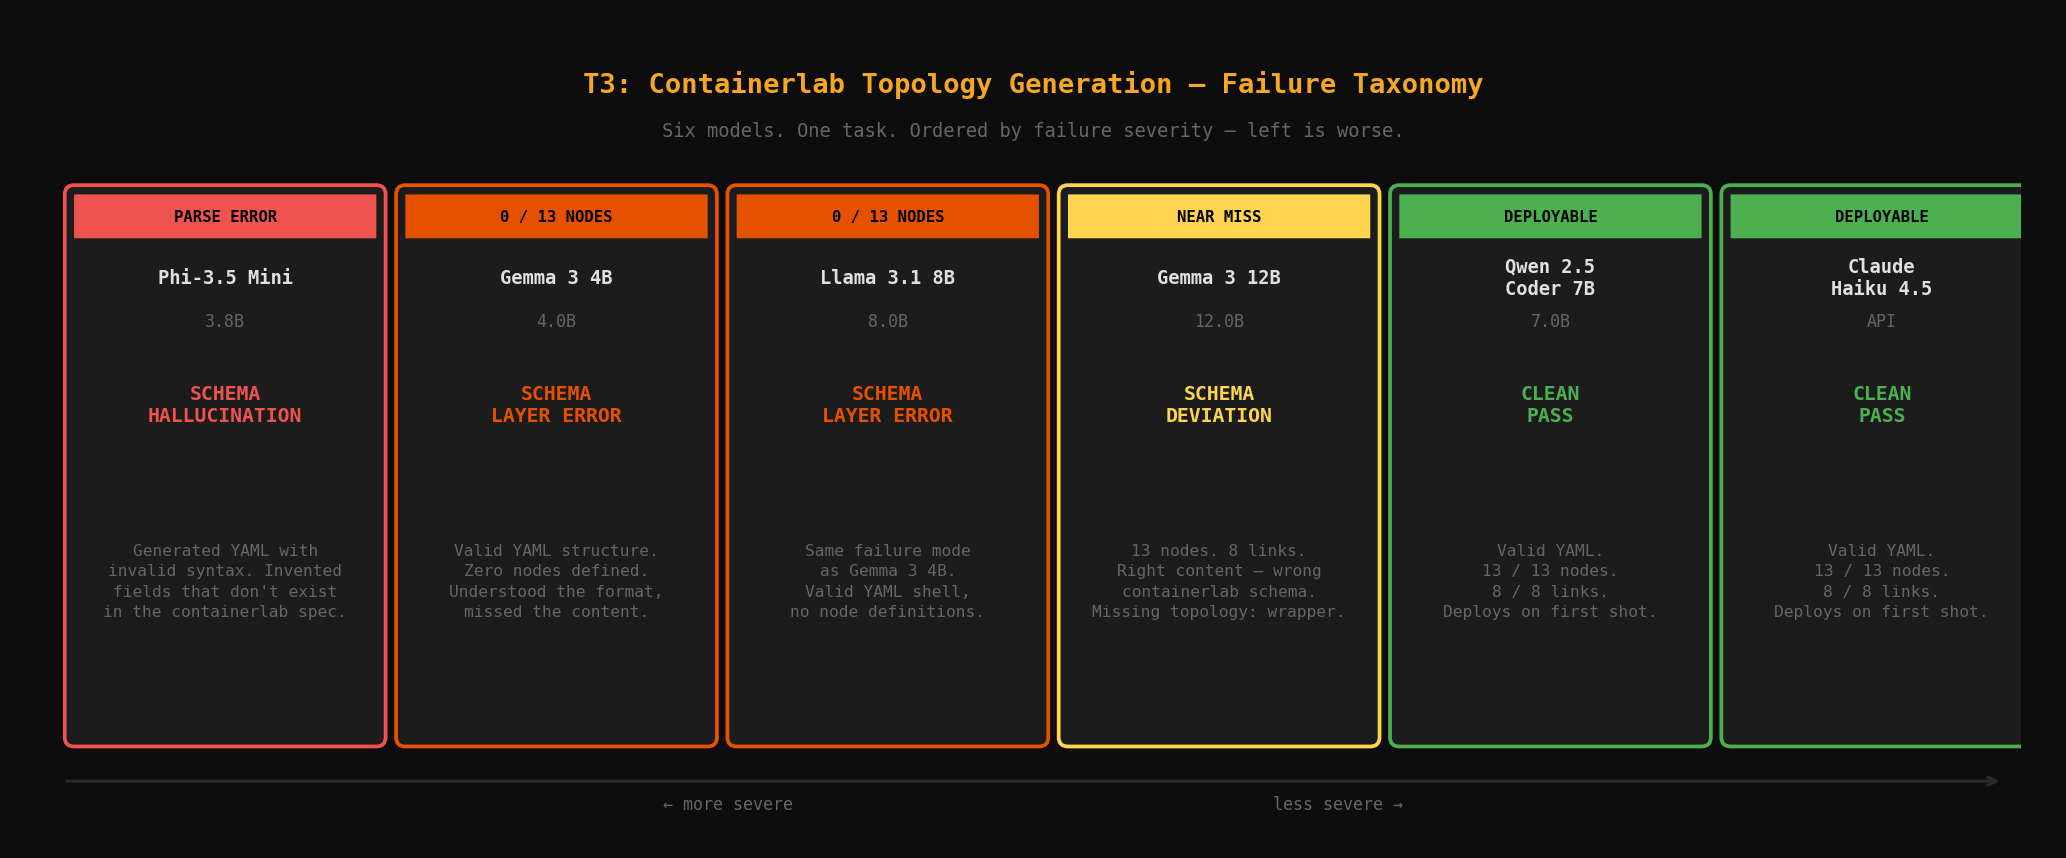
- Schema hallucination (Phi-3.5): broken YAML structure. The model invented syntax that doesn't exist in the containerlab spec.
- Schema layer error (Gemma 4B, Llama 8B): valid YAML, wrong semantics. The model understood the format but misplaced the node definitions.
- Generation refusal (Gemma 12B): produced prose instead of YAML. An instruction-following failure, not a capability gap.
- Clean pass (Qwen, Haiku): deployable output on first shot.
A model that generates wrong-but-parseable YAML can potentially be corrected with a better-structured prompt. A model that refuses to generate YAML at all has a different kind of problem. These are not the same failure and they don't get solved the same way.
T1 surfaced a sharper issue with Phi-3.5.
The BGP metric table contained a clear breach condition: a session that had exceeded the reset threshold. Phi-3.5 read the table and reported: "No threshold breaches were detected."
That's not a format failure. The model processed the data and returned a false negative. In an ops context, a false negative on a breach condition is worse than no answer. It signals the all-clear when it shouldn't.
T4 and T5 failed for Haiku. But not because of Haiku.
Haiku's T4 output was cut off before export default. T5 had a syntax error at line 61. Both failures traced to the same cause: I calibrated token budgets (700 for T4, 600 for T5) against local model verbosity. Haiku generates more complete, more thoroughly structured code. It hit the token ceiling mid-component and got cut off.
The test penalized thoroughness. That's a test design error, not a model error. It gets corrected in Part 2.
The Hardware Finding
Expected throughput: 15–20 tok/s for VRAM-resident models, 8–12 tok/s for CPU-spill models. A clear performance cliff at the 4GB boundary.
What I got: consistent throughput regardless of model size. Phi-3.5 at 19 tok/s. Qwen at 9 tok/s. Gemma 3 4B at 16 tok/s. The pattern I expected wasn't there.
Mid-run I checked ollama ps:
NAME               SIZE     PROCESSOR    UNTIL
phi3.5:latest      3.7 GB   100% CPU     4 minutes from now
Then nvidia-smi:
memory.used [MiB]: 5 MiB
utilization.gpu [%]: 0 %
The T600 was idle. Every token in this benchmark was generated by the i7-12700H.
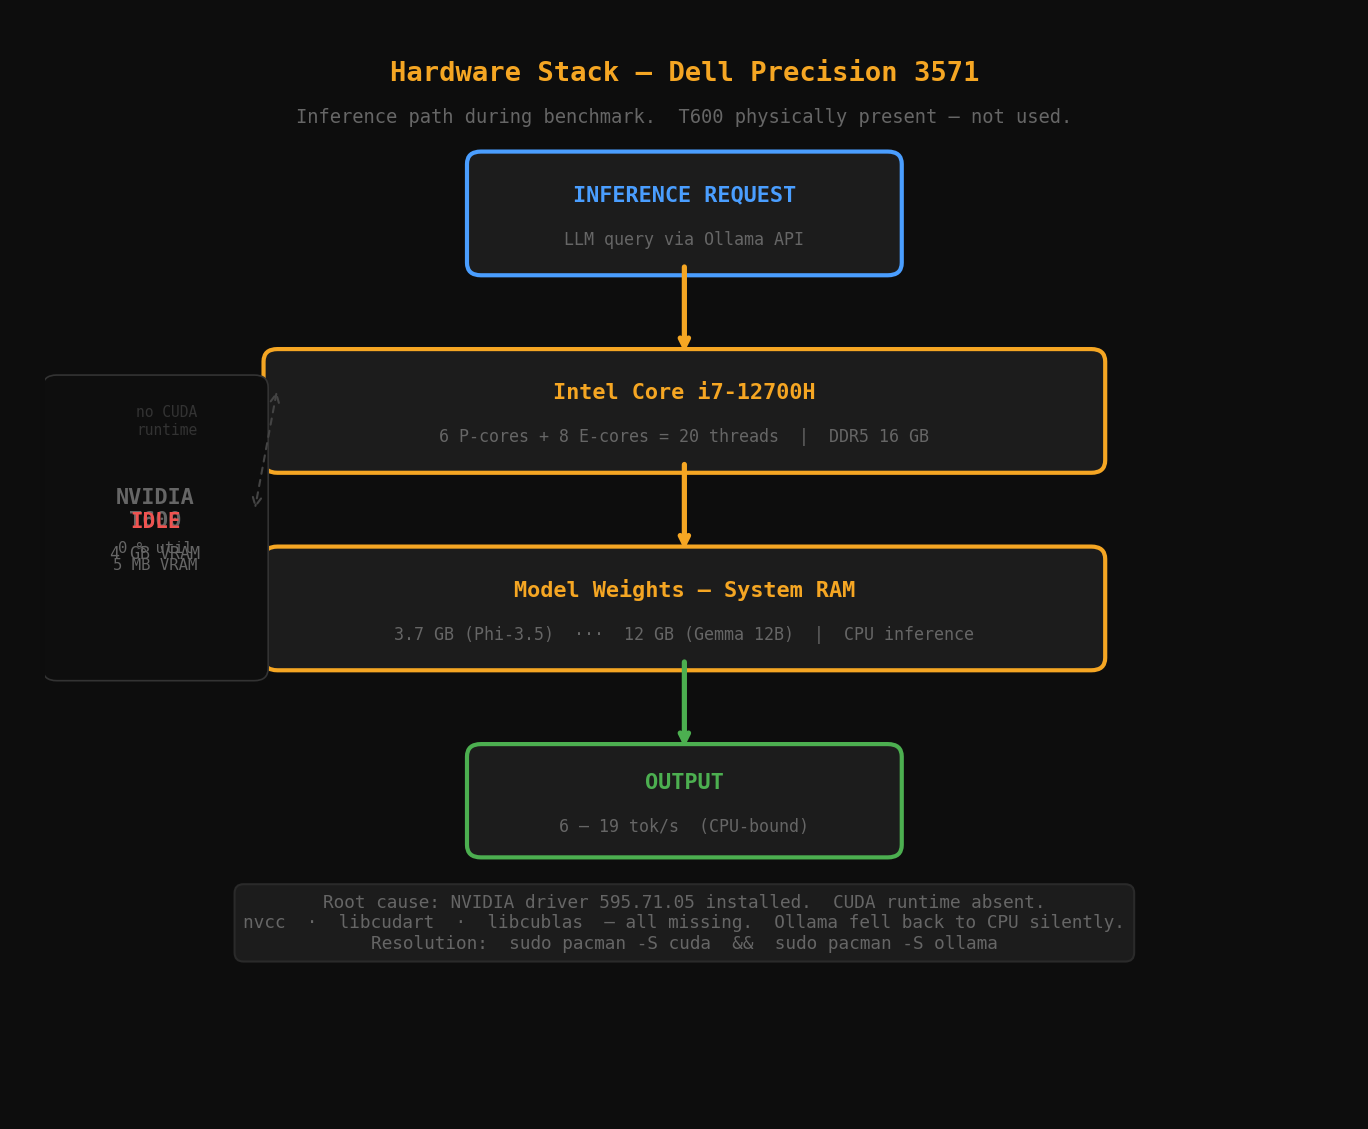
Root cause: Ollama needs the CUDA runtime to drive GPU inference, not just the NVIDIA driver. The driver was present (595.71.05). The CUDA runtime was not. nvcc absent. libcudart absent. libcublas absent. Ollama detected no viable GPU compute path and fell back to CPU without warning. An Ollama server/client version mismatch (0.23.2 vs 0.24.0) compounded the silence.
This means the hardware characterization I planned: VRAM-resident versus CPU-spill curves, T600 thermal behavior under sustained inference, actual VRAM utilization by model size, is unanswerable from this data. All tok/s figures are i7-12700H CPU throughput. The T600 is a spectator.
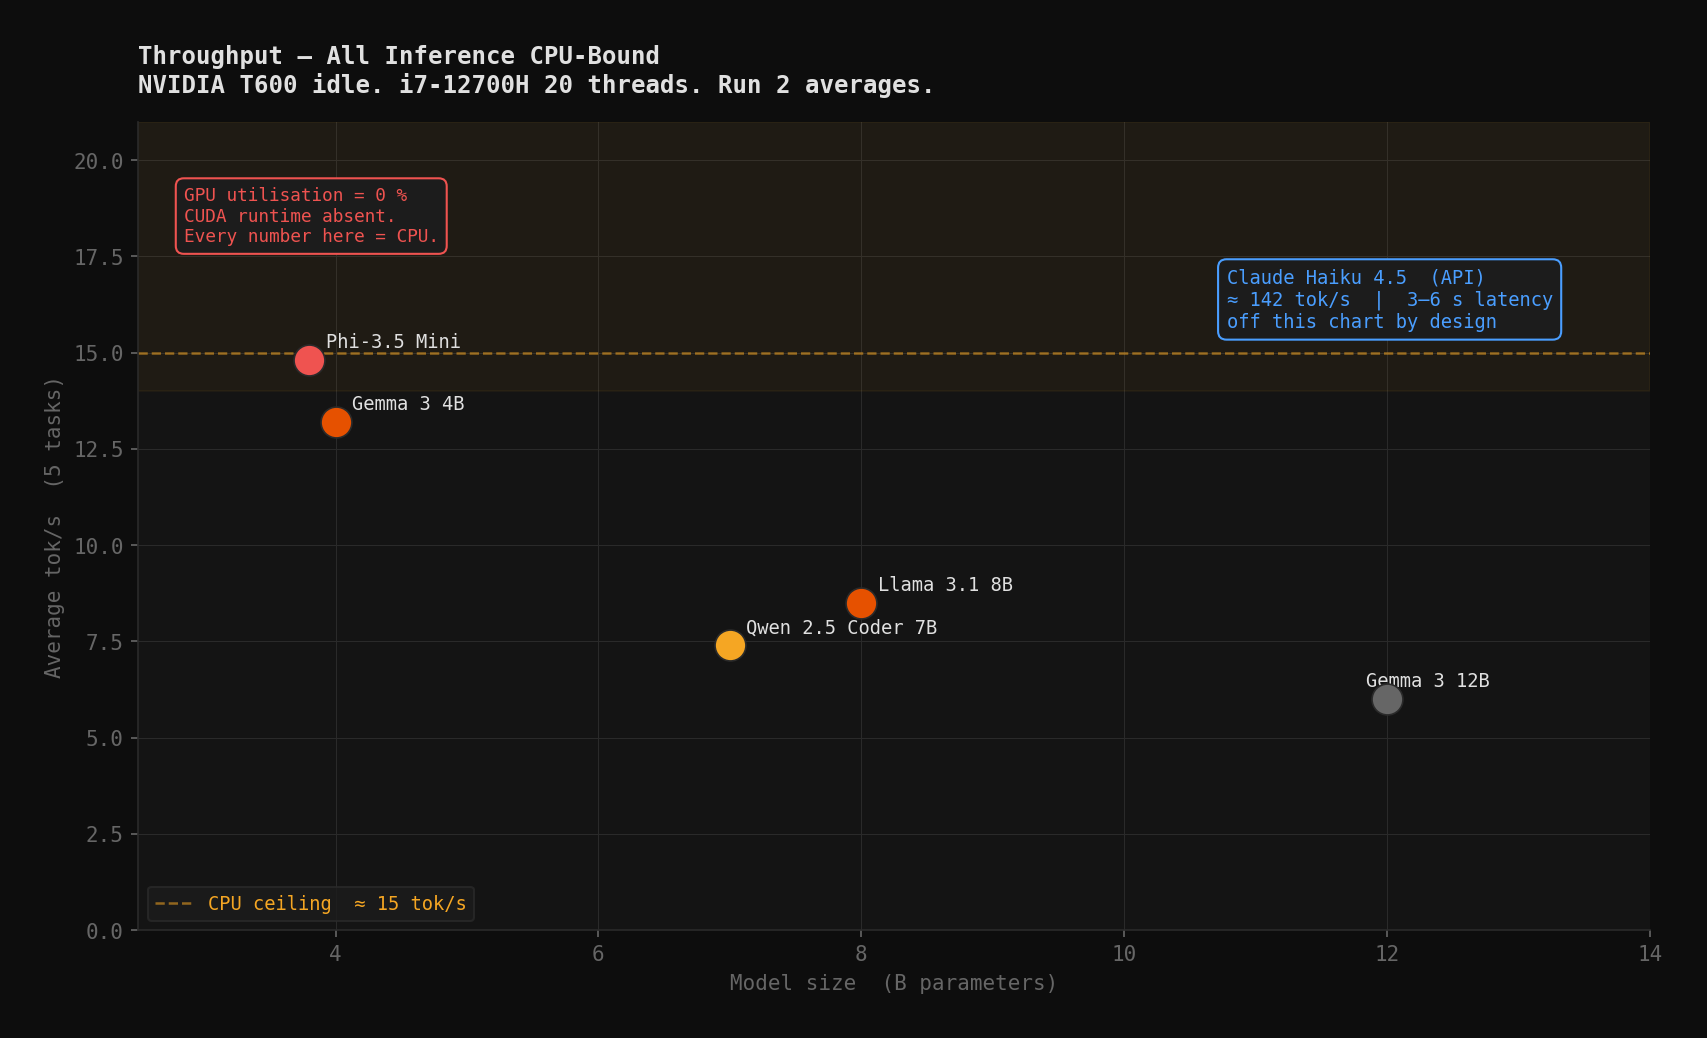
The quality results stand. Where computation happens doesn't change what the model outputs. But every throughput number needs to be read as CPU-bound inference on a 20-thread i7. This is documented as a finding, not cleaned up and hidden. It's what actually happened.
The Scores
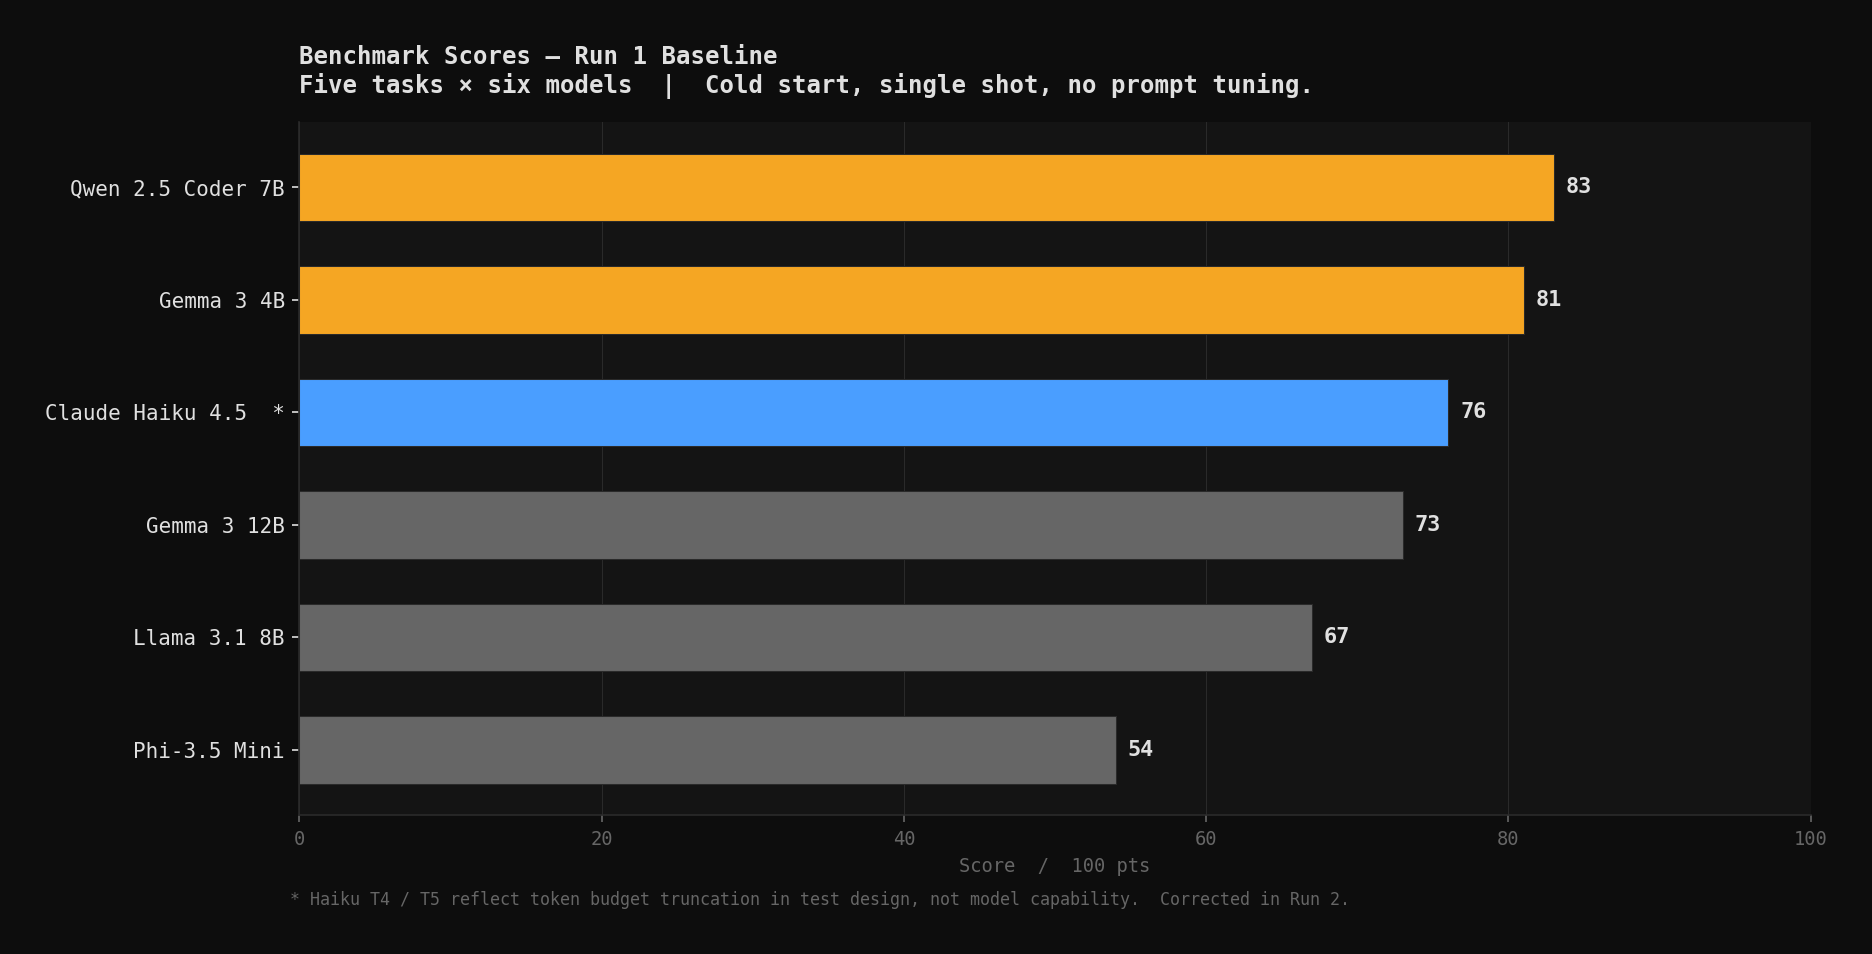
Scored across five dimensions: accuracy, completeness, format compliance, operational clarity, code quality. 100 points total.
| Model | Score | Notes |
|---|---|---|
| Qwen 2.5 Coder 7B | 83/100 | Only local model to pass T3 |
| Gemma 3 4B | 81/100 | T3 structural failure; T4/T5 clean |
| Claude Haiku 4.5 | 76/100* | T4/T5 scores reflect token truncation, not output quality |
| Gemma 3 12B | 73/100 | T3 generation refusal; 6 tok/s under CPU load |
| Llama 3.1 8B | 67/100 | T3 valid YAML, zero nodes |
| Phi-3.5 Mini | 54/100 | T1 false negative on breach; T3 malformed YAML |
*Haiku's actual capability is higher than this number. Part 2 corrects the test design.
Gemma 3 12B at 73 is the most misleading number in the table. More parameters did not produce better outputs. It scored reasonably on the non-T3 tasks, but at 6 tok/s CPU-bound and a T3 generation refusal, the latency cost alone makes it a difficult fit for anything in the voice loop. At 6 tok/s, a 1,400-token topology requires at least 230 seconds just to print. The test enforced a 300-second timeout. I didn't give the model a generation refusal. I gave it a stopwatch it couldn't beat. You pay more, wait longer, and get a prose description when you needed YAML.
Phi-3.5 at 54 reflects a model that is fast but not reliable for ops data interpretation. A false negative on a breach condition is a disqualifying failure for triage tasks.
Where This Leaves Things
T3 is the gate. Pass it and you're in the conversation for routing to topology and config generation tasks. Fail it and you're limited to triage and summarization. One local model passed: Qwen 2.5 Coder 7B.
The latency question is open. Haiku responds in 3–6 seconds at 200+ tok/s via API. Qwen T3 took 157 seconds on CPU. For topology generation as a background task, 157 seconds is acceptable if the output deploys clean. For anything in the voice loop, it's not.
The GPU question is completely unanswered. Nothing about these results tells us what happens when the T600 is actually doing the work.
The test design had a flaw that disadvantaged the calibration baseline. It's corrected in Part 2: extended token budgets for T4 (1000 tokens) and T5 (900 tokens), extended timeout for the 12B model, and hardware monitoring active throughout.
Part 2: every model gets its best shot. Then we score what we see.
The Right Tool is a field series on local LLM deployment in a live network lab. Part 2 covers the corrected test. Part 3 covers GPU-enabled hardware characterization after CUDA installation.