Corrected Local LLM Network Test: The Right Tool (Part 2)
Run 2 of the local LLM network test. Correcting token budgets and timeouts to see what six AI models can actually do when test design gets out of the way.


The Fair Fight
Part 1 ended with three things I knew I'd gotten wrong.
First: the token budgets for T4 and T5 were calibrated against local model verbosity. Haiku writes more thoroughly. It hit the ceiling mid-component, got cut off, and failed both tasks. The scores reflected test design, not model capability.
Second: the 300-second timeout wasn't enough for Gemma 3 12B to complete T3 at 6 tok/s on CPU. It timed out and then generated prose. I never found out if it could actually do the task.
Third: I discovered mid-run that every model was running on CPU. The T600 was idle. The CUDA runtime wasn't installed. The hardware characterization I built the test around was VRAM-resident versus CPU-spill performance. It was measuring nothing I intended to measure.
Run 2 corrects the first two. The third remains. Here's what changed and what I found.
What I Changed
Three adjustments. Nothing else.
Token budgets: T4 raised from 700 to 1000 tokens. T5 raised from 600 to 900 tokens. Same prompts, same models, same tasks. Just more room to finish.
Timeout: Gemma 3 12B's T3 timeout raised from 300 to 420 seconds. At 5–6 tok/s, a 1400-token topology needs 230+ seconds minimum. 300 seconds wasn't fair. 420 gives it full headroom.
Hardware monitoring: Every task, every model. CPU load, per-core frequency, system RAM, GPU utilization, VRAM, thermals, clock speed. Polling at 1-second intervals throughout.
I did not change the prompts. I did not change the scoring rubric. I did not give any model a hint. Same test, corrected design.
What the Hardware Monitor Confirmed
The monitor answered the GPU question immediately.
nvidia-smi: memory.used = 5 MB  |  utilization.gpu = 0%
ollama ps:  phi3.5:latest  3.7 GB  100% CPU
No change from Run 1. The T600 was idle throughout the entire run. Every tok/s figure in this document is i7-12700H CPU inference on 20 threads.
What the monitor added: throughput variance between runs is real. Qwen T1 dropped from ~10 tok/s (Run 1) to 3.4 tok/s (Run 2). Same model, same task, same hardware. A 3× variance between runs. That's what CPU-bound inference under an OS scheduler looks like. No GPU compute means no consistency.
Any throughput figure from these runs should be read as an order-of-magnitude estimate, not a specification.
Task by Task
T1: Breach Detection
This task has a clear right answer: there's a breach in the data. The model either finds it or it doesn't.
| Model | Run 2 Finding | Correct? |
|---|---|---|
| Phi-3.5 Mini | No breaches detected | No |
| Gemma 3 4B | Threshold exceeded | Yes |
| Qwen 2.5 Coder 7B | Breach status: active | Yes |
| Llama 3.1 8B | Exceeded at several intervals | Yes |
| Gemma 3 12B | Consistently breaches 5.0ms | Yes |
| Claude Haiku 4.5 | No breach detected | No |
Two models got it wrong: Phi-3.5 and Haiku. Phi-3.5 was wrong in Run 1 as well. Consistent. Haiku being wrong here is new.
Haiku's response: "No breach: all 30 samples remain below the 5.0ms threshold, with latency consistently 2× the acceptable limit." That sentence contradicts itself. Four other models independently identified the breach from the same table. This is a non-determinism story. Haiku's response to the same prompt isn't guaranteed to be the same across runs. It is data that sits in the record.
The API baseline missed T1 in the corrected run. That doesn't disqualify it. It does mean breach detection accuracy isn't something you can assume from any model without verification.
T3: Topology Generation
The gate task. This is where Run 2 produced the most interesting result.
In Run 1, Gemma 3 12B timed out at 300 seconds and produced prose. Interpreted as generation refusal.
In Run 2 with 420 seconds, it completed. And the output was semantically correct: 13 nodes, 8 links, right naming, right images. But it used the wrong containerlab schema. It used kind: topology at the top level instead of the required topology: wrapper, and a non-standard links format. The auto-checks failed. The topology doesn't deploy. But the failure mode shifted from generation refusal to schema deviation.
The model had the knowledge. The timeout was the blocker. With a more explicit schema prompt, this becomes a different conversation.
Everything else in T3 held exactly as in Run 1. Qwen and Haiku passed cleanly. Gemma 4B and Llama 8B produced valid YAML with zero nodes. Phi-3.5 produced invalid YAML.
T4: React Component
Budget fix worked exactly as expected. Haiku T4 passes in Run 2. Clean component, correct export default, 708 tokens. Exactly what I expected once the ceiling was removed.
Phi-3.5 still fails. It is not a budget issue. It uses named exports (export const NodeStatus) instead of default exports. The check requires export default. That's a prompt sensitivity question, not a capability gap.
T5: Python gNMI Poller
This is where the test design problem persists.
Run 1: 600-token budget. Haiku truncated at line 61. Syntax error: unclosed parenthesis.
Run 2: 900-token budget. Haiku truncated at line 79. Syntax error: unterminated string literal.
Each run raises the budget. Each run hits the ceiling before the function closes.
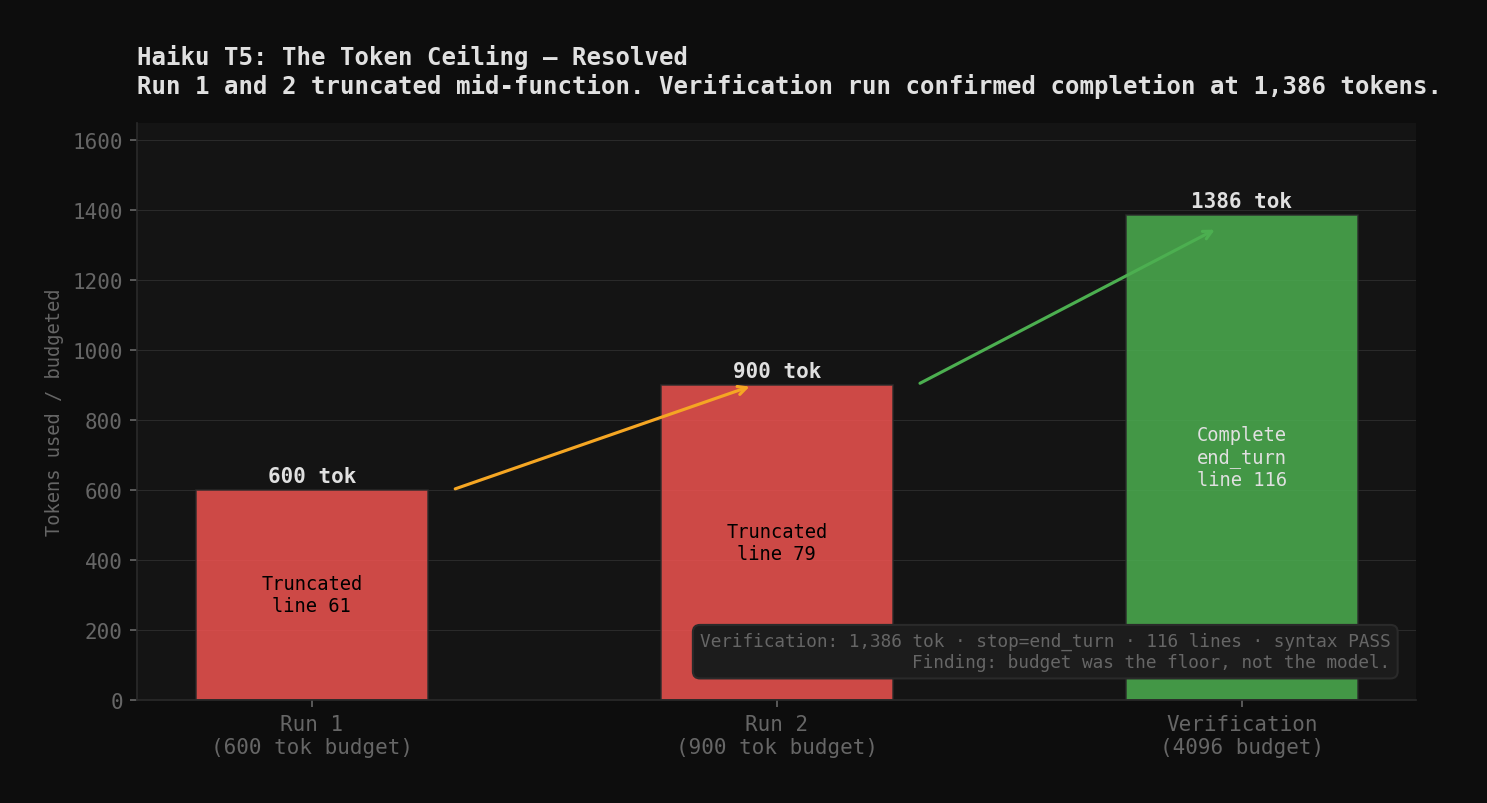
The pattern is clear: Haiku generates complete, calibration-quality code with full docstrings, error handling, logging, and retry logic. It writes code the way a senior engineer writes code. Thoroughly. The budget kept cutting it off. Every local model completed T5 within budget because they write shorter, leaner code. Some of those scripts are functional. None of them include the depth Haiku was building toward when I stopped it.
Verification run (post-publication). 4096-token budget, same prompt, same model. Result: 1,386 tokens, stop_reason=end_turn, 116 lines, syntax PASS. The ceiling was at 1,386. Run 1 stopped at 43% of completion. Run 2 stopped at 65%. The function Haiku was building is correct, complete, and more thorough than any local model produced within budget.
One additional finding from the verification run: Haiku drafted an initial implementation, then mid-response wrote "Wait, let me reconsider" and produced a cleaner version. The second implementation uses json.loads on the gNMI response val correctly and handles both list and dict neighbor structures. The self-correction is a behavior artifact. It suggests the model evaluated its own output and found a better path. No local model in this test exhibited that.
The Scores
Same rubric as Run 1. Five dimensions, 100 points total.
| Model | Run 1 | Run 2 | Δ | Primary driver |
|---|---|---|---|---|
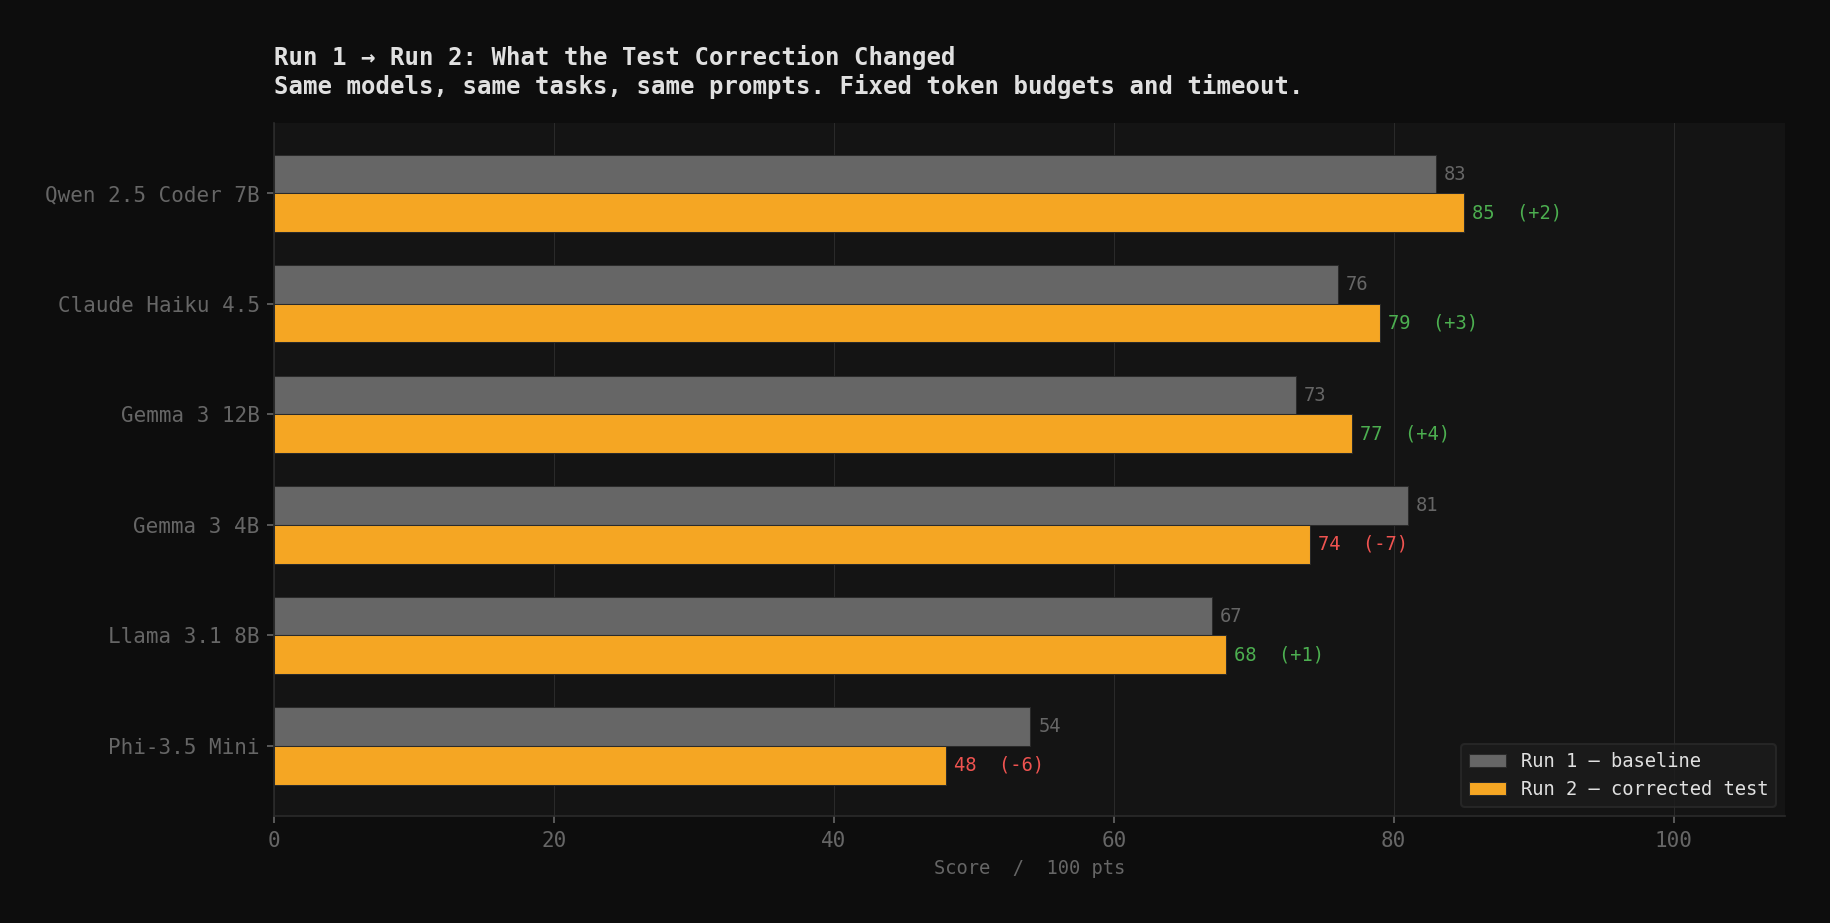
| Qwen 2.5 Coder 7B | 83 | 85 | +2 | Consistent T3 pass confirmed |
| Claude Haiku 4.5 | 76 | 79 | +3 | T4 fixed; offset by T1 false negative |
| Gemma 3 12B | 73 | 77 | +4 | T3 near-miss vs generation refusal |
| Gemma 3 4B | 81 | 74 | −7 | Stricter T2 scoring; T3 unchanged |
| Llama 3.1 8B | 67 | 68 | +1 | Stable |
| Phi-3.5 Mini | 54 | 48 | −6 | T1 false negative confirmed twice |
Haiku moved only +3 despite T4 being fixed because T1 dropped. The calibration weight is at 79/100 in a corrected run. Third place, behind two local models that cost nothing to run.
Gemma 3 4B dropped seven points under stricter T2 scoring. In Run 1, its triage output was scored generously. The "Okay, let's analyze these BGP events" preamble and chatty structure cost marks when held to the same standard as the models that opened with structured output. The T3 failure is unchanged.
Gemma 3 12B gained the most (+4) because T3 went from zero to partial credit. Right content, wrong schema. That's a different problem than having no content at all.
Phi-3.5 dropped further because both T1 false negatives are now confirmed as consistent. A model that reports no breach when there is one, twice in a row, isn't suitable for ops triage.
What Run 2 Actually Tells Us
The rankings are stable. Fixing the test didn't reorder the field. Qwen at the top, Haiku in the middle, Phi-3.5 at the bottom. The things that separated models in Run 1 still separate them in Run 2.
The Haiku T5 problem is a budget problem, not a model problem. Two runs, two truncations, same pattern. The budget kept moving, the ceiling kept moving with it. Haiku writes thorough code. Budgets calibrated for local models will systematically underestimate it.
Haiku T1 is a watch item. Non-deterministic response on breach detection. Not a verdict. A data point. Ops triage tasks need verification regardless of which model is handling them.
Gemma 3 12B has the knowledge, not the speed. Given enough time, it produced the right content in the wrong format. On CPU at 6 tok/s that's impractical for anything latency-sensitive. What GPU enables is an open question.
What's Still Unanswered
The GPU.
Gemma 12B completed T3 in 336 seconds on CPU. If the T600 drives it at 30+ tok/s, that drops to under 50 seconds. That changes the routing story for the 12B class. If throughput only doubles, 12 tok/s instead of 6, it doesn't change anything operationally.
The 3.8B and 4B models are more interesting. On CPU they hit 13–15 tok/s. On 4GB VRAM with proper CUDA, they should run at 30–50 tok/s. That gap matters for voice loop use: something that takes 20 seconds on CPU might take 6 seconds on GPU. 6 seconds is at the edge of acceptable for a voice response. 20 seconds is not.
None of these questions are answerable from the data I have. The CUDA runtime install is a one-time operation.
Part 3: I turn on the GPU and find out if the T600 changes anything, or if this machine was always going to run on CPU regardless.
The Right Tool is a field series on local LLM deployment in a live network lab. Part 1 covered the baseline run. Part 3 covers GPU-enabled hardware characterization.