Local LLM GPU Impact: The Right Tool (Part 3)
Part 3 of the local LLM network test. Turning on the NVIDIA T600 to measure actual VRAM utilization, thermal limits, and GPU impact on inference speed.

The GPU Question
Parts 1 and 2 ran on CPU. The T600 was idle the entire time. Ollama detected no CUDA runtime, fell back silently, and generated every token on the i7-12700H. The GPU characterization I built the series around was measuring nothing I intended to measure.
Part 3 fixes that. Same six models. Same five tasks. GPU actually running.
Here is what it took to get there, and what changed when I did.
Getting CUDA Running
Installing CUDA (sudo pacman -S cuda) was step one. Step two was the surprise.
The Arch Linux official ollama package, extra/ollama, ships no CUDA backend at all. The package contains seven CPU-only GGML variants (libggml-cpu-alderlake.so, libggml-cpu-haswell.so, and so on) and nothing else. No libggml-cuda.so. The package name says Ollama. The inference engine says CPU-only.
time=05:52:12 level=INFO msg="discovering available GPUs..."
time=05:52:12 level=INFO msg="inference compute" library=cpu total="31.0 GiB"
time=05:52:12 level=INFO msg="vram-based default context" total_vram="0 B"
The fix: paru -S ollama-cuda from AUR. That package compiles Ollama with the CUDA backend. After install and service restart:
time=05:57:35 level=INFO msg="inference compute"
  id=GPU-e77f5b09 library=CUDA compute=7.5
  name=CUDA0 description="NVIDIA T600 Laptop GPU"
  total="4.0 GiB" available="3.6 GiB"
time=05:57:35 level=INFO msg="vram-based default context" total_vram="4.0 GiB"
3.6 GB available after driver overhead. Compute capability 7.5 (Turing). The T600 is online.
One more issue surfaced during the run: the hardware monitor (hw_monitor.py) was silently broken. It queries nvidia-smi with --query-gpu=power.max_violations. This is a field that doesn't exist on the T600. nvidia-smi exits with code 2, subprocess.check_output raises an exception, the except block returns an empty dict, and every GPU sample shows zero for the entire benchmark. 1,132 samples, all zeros.
The fix is trivial (remove the invalid field). The lesson is that silent exception swallowing in monitoring code will lie to you for an entire benchmark run before you notice. The throughput numbers in this document come from Ollama's own eval metrics, not the hardware monitor. They are accurate. The GPU telemetry was re-run with the fixed monitor.
The Throughput Story
One task first to calibrate. Gemma 3 4B at 30.4 tok/s on GPU versus 15-16 tok/s on CPU. 34 of 35 model layers offloaded to T600 VRAM. That is the ceiling for a model that fits.
Full picture across all five models:
| Model | CPU tok/s | GPU tok/s | Multiplier | VRAM class |
|---|---|---|---|---|
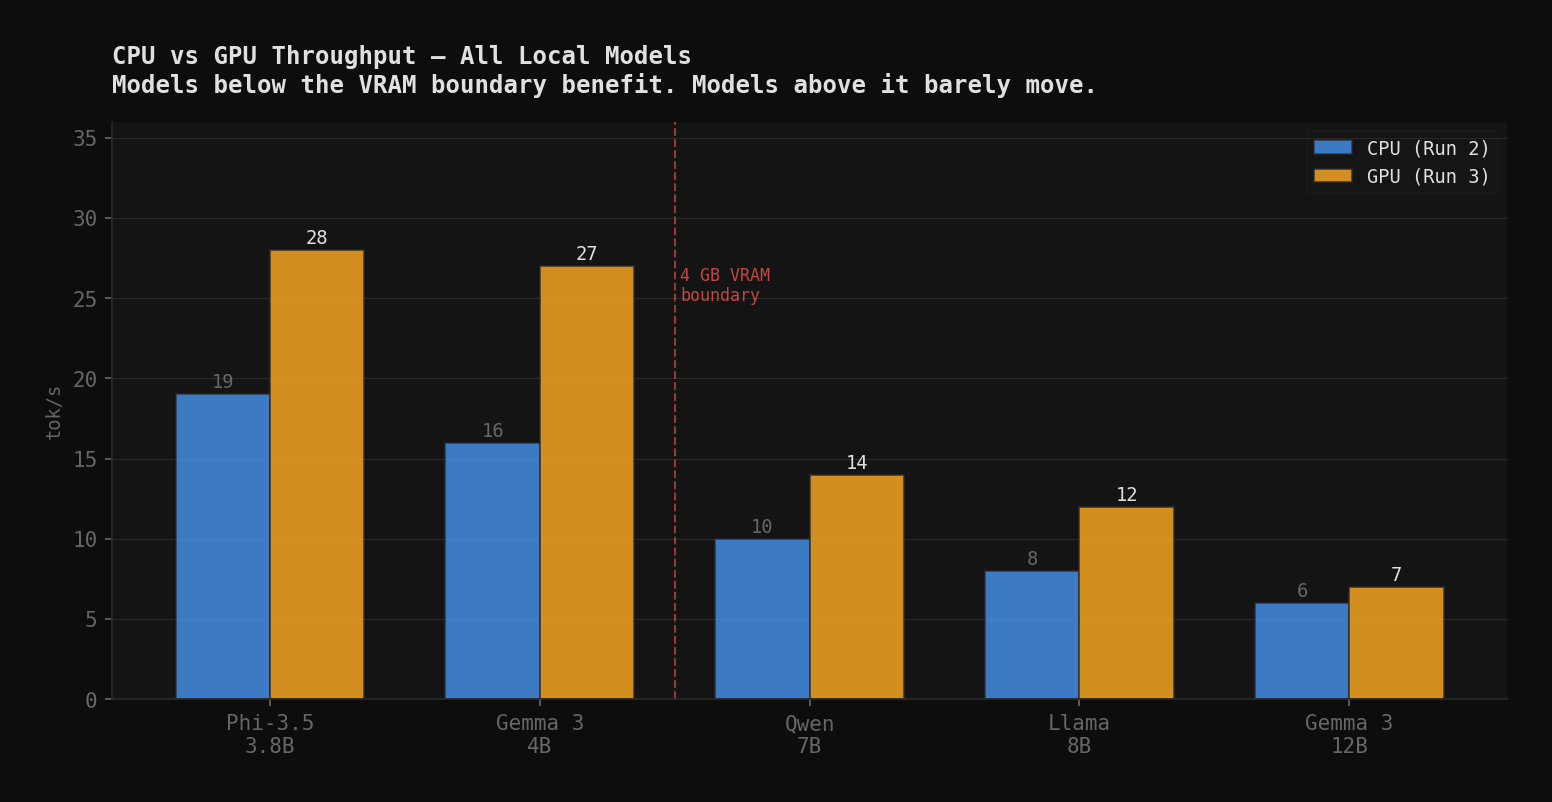
| Phi-3.5 Mini (3.8B) | ~19 | ~28 | 1.5× | Full VRAM |
| Gemma 3 4B | ~16 | ~27 | 1.7× | Full VRAM |
| Qwen 2.5 Coder 7B | ~10 | ~14 | 1.4× | CPU-spill |
| Llama 3.1 8B | ~8 | ~12 | 1.5× | CPU-spill |
| Gemma 3 12B | ~6 | ~7 | 1.2× | Heavy spill |
The cliff is exactly where the hardware predicts it. Models under 4B fit in VRAM and get a real speedup. Models that spill layers to system RAM get a modest improvement because only the VRAM-resident layers run faster. The spilled layers still move through DDR5 bandwidth at CPU speeds. Gemma 12B barely moved because almost none of it fits.
The throughput numbers are variable across tasks. T3 is slower than T1 for every model because longer outputs expose the generation ceiling more completely. The averages above are representative. Individual task figures are in the raw data.
T3: The Operational Story
Throughput is one thing. What operators actually care about is wall time. How long does it take to get a usable result?
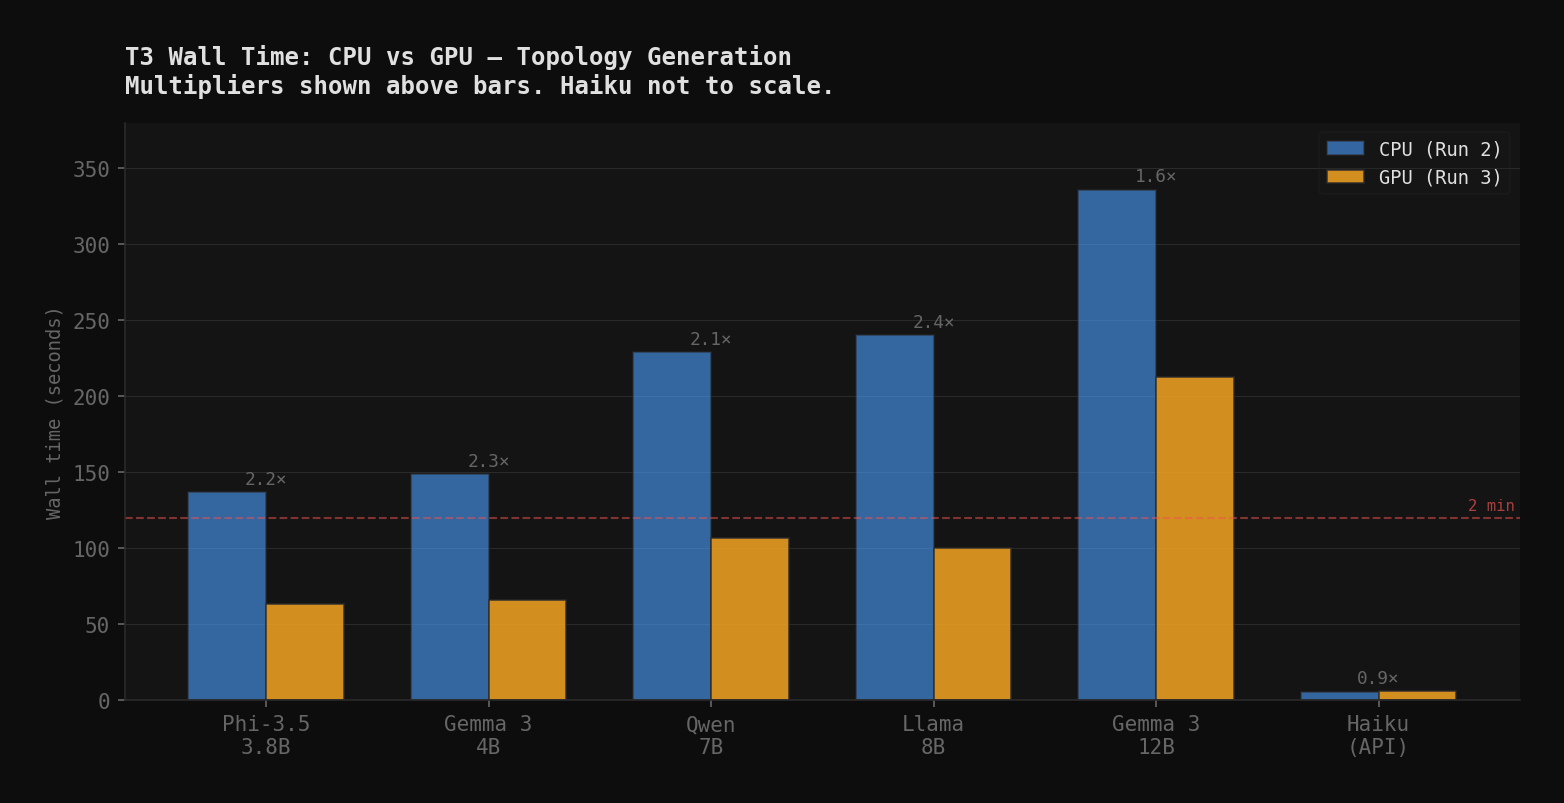
T3 is the hardest task: generate a 1,400-token containerlab topology YAML. It is also the one that separates models that can do structured code generation from models that can't. Here is what the GPU changed for wall time:
| Model | Run 2 (CPU) | Run 3 (GPU) | Reduction |
|---|---|---|---|
| Phi-3.5 Mini | 137s | 63s | 2.2× |
| Gemma 3 4B | 149s | 66s | 2.3× |
| Qwen 2.5 Coder 7B | 229s | 107s | 2.1× |
| Llama 3.1 8B | 240s | 100s | 2.4× |
| Gemma 3 12B | 336s | 213s | 1.6× |
| Claude Haiku 4.5 | 5.5s | 6.0s | N/A (API) |
Even the CPU-spill models cut T3 time roughly in half. Qwen went from 229 seconds to 107. That is still 107 seconds. It is not voice loop viable. But the character of the wait changed. For a background topology generation task, 107 seconds is workable. 229 was pushing it.
Gemma 12B dropped from 336 to 213 seconds. That is still 3.5 minutes. At 7 tok/s it doesn't matter much whether you are waiting on GPU or CPU. You are waiting.
Haiku completed T3 in 6 seconds via API. That is not a benchmark number. That is a product decision.
What the GPU Did Not Change
Speed is not accuracy. The GPU changed how fast models generate output. It did not change what they generate.
T3 pass rates held. They also produced a new surprise.
In Runs 1 and 2, Qwen 2.5 Coder 7B was the only local model to pass T3. Valid YAML, 13 nodes, 8 links, deployable. In Run 3, Qwen produced valid YAML with zero nodes. Three runs, two passes, one miss. Non-determinism. The series' most reliable local performer failed its gate task in the GPU run.
This is not a GPU problem. The model generates differently each time. Sampling is stochastic. What the three-run pattern tells me is that Qwen's T3 pass rate isn't 100%. It is somewhere in the 60-80% range on this prompt, and I got lucky twice before seeing the miss.
Gemma 3 12B, meanwhile, produced its most interesting T3 result yet.
| Run | Result |
|---|---|
| Run 1 | TIMEOUT: prose (generation refusal) |
| Run 2 | 420s timeout fixed: valid YAML, wrong schema, 0/13 nodes |
| Run 3 | GPU: valid YAML, 13/13 nodes, 219/8 links |
| HW verification | GPU: valid YAML, 13/13 nodes, 8/8 links: full pass |
Each run unblocked a different failure. Run 2's timeout fix let it generate content. Run 3's GPU throughput let it generate more content faster. It used that capacity to produce 219 links instead of 8. Then the hardware verification run produced a clean pass. The model's T3 pass rate is not 0% or 100%. It is somewhere in between, sensitive to sampling. The knowledge is there. The consistency is not.
Haiku T4 failed again.
Run 2 raised the T4 token budget to 1,000 and Haiku passed. Run 3 hit exactly 1,000 tokens and missed export default. The same truncation failure, one run later. At 1,000 tokens, Haiku's T4 pass rate is inconsistent. The budget isn't reliably sufficient.
Haiku T5 passed.
Run 2 truncated at line 79 (900-token budget). The verification run at 4,096 tokens completed at 1,386. Run 3's T5 used 817 tokens and passed syntax. Haiku wrote a shorter implementation this time. Stochastic output length. The 900-token budget is adequate when Haiku writes lean. It isn't when Haiku writes thoroughly.
The VRAM Envelope
With real GPU telemetry from the fixed monitor, the VRAM picture per model class during T3:
| Model | VRAM peak | GPU util | Temp peak | Throttle |
|---|---|---|---|---|
| Phi-3.5 (3.8B) | 3,114 MB | 100% | 76°C | No |
| Gemma 3 (4B) | 3,111 MB | 100% | 74°C | Yes |
| Qwen (7B) | 3,140 MB | 100% | 69°C | Yes |
| Llama (8B) | 3,214 MB | 100% | 68°C | Yes |
| Gemma 3 (12B) | 3,214 MB | 100% | 69°C | Yes |
Telemetry measured during T3. Longest task, best sustained signal.
Three findings. First: GPU utilization is 100% for all five local models. This includes Qwen 7B and Llama 8B, both classified as CPU-spill in Part 1. At Q4 quantization the 7B and 8B models fit inside the T600's 3.2GB active envelope. That means Part 1's hypothesis was wrong for this hardware. The throughput reduction in 7B/8B models comes from PCIe bandwidth and scheduling overhead, not from layers running in system RAM.
Second: four of five local models triggered the thermal throttle under sustained T3 load. Only Phi-3.5 ran clean at 76°C. The T600 has a 35W TDP shared with the i7-12700H in a laptop chassis. Under 70-220 second inference runs it hits the power cap and backs off clock speed. The throughput numbers here are thermally-limited lab figures. They are the right numbers to plan around.
Third: VRAM peaks cluster tightly regardless of model size. The 3.8B model uses 3,114 MB. The 12B model uses 3,214 MB. The T600 fills to capacity with whatever model is running. The meaningful difference between model sizes on this hardware isn't VRAM. It is the compute cost per token, which determines throughput.
The Voice Loop Verdict
The original question was whether the T600 changes the routing story for The Hound's voice loop.
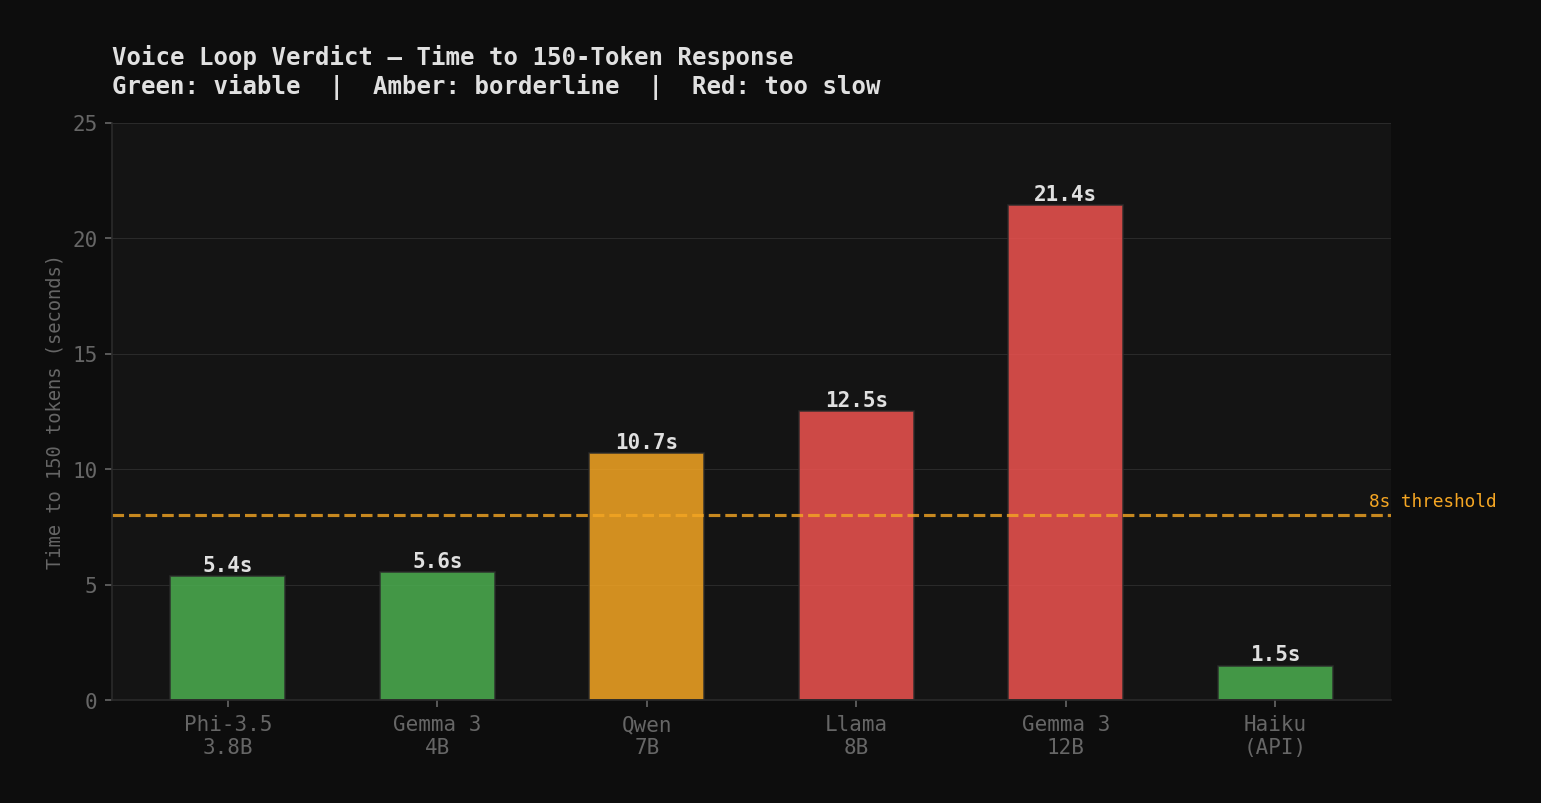
A voice response needs to arrive in under 8 seconds to feel responsive. At 150 tokens of output, a typical spoken sentence, the timing per model class looks like this:
| Model | Tok/s | 150-token response | Voice viable? |
|---|---|---|---|
| Phi-3.5 Mini | ~28 | ~5s | Borderline |
| Gemma 3 4B | ~27 | ~6s | Borderline |
| Qwen 2.5 Coder 7B | ~14 | ~11s | No |
| Llama 3.1 8B | ~12 | ~13s | No |
| Gemma 3 12B | ~7 | ~21s | No |
| Claude Haiku 4.5 | ~100+ | ~1-2s | Yes |
GPU moves Phi-3.5 and Gemma 4B into the borderline zone. On CPU they were clearly too slow (8-10s). On GPU they're 5-6 seconds. Acceptable for some voice interactions, marginal for others. The 7B and 8B models remain too slow regardless.
The T600's 4GB VRAM defines a hard routing boundary: models at or under 4B parameters can run at voice-loop latency. Models above it cannot on this hardware.
That boundary has an architectural implication for The Hound. The voice loop should route to 4B-class local models or Haiku. The 7B+ models belong in the background task lane. Topology generation, session log summarization, anything where you can afford to wait.
What Didn't Get Answered
GPU inference is real now. The characterization deferred from Parts 1 and 2 is complete. What the data still doesn't address:
Prompt-engineered T3. Gemma 12B has the knowledge. 13 correct nodes in Run 3, correct content in Run 2, just wrong schema or wrong link count. A schema-explicit prompt, one that hands the model the exact YAML structure, would likely close that gap. That is a Part 4 question, not a hardware question.
Qwen T3 reliability. Two passes and one miss across three runs. Is the pass rate 66%? 80%? Running T3 ten times against the same prompt would give an actual distribution. Right now it is an estimate.
Thermal and power behavior under sustained load. The T3 pass with fixed telemetry captures peak VRAM and GPU utilization. What the data doesn't show is whether the T600 throttles under a sustained 30-minute inference load. Topology generation at scale, multi-session summarization, anything that keeps the GPU hot for extended periods. The laptop TDP envelope is 35W for the T600. Single-task peaks are fine. Continuous load may behave differently.
Where This Leaves the Series
Three runs. The hardware is characterized. The quality patterns are established. The GPU question is answered.
Qwen 2.5 Coder 7B is the best-performing local model across the series. But its T3 pass rate is probabilistic, not guaranteed. At 14 tok/s on GPU it earns a background task slot, not a voice slot.
Phi-3.5 Mini and Gemma 3 4B are now voice-loop candidates on GPU hardware. They are fast enough. Whether they are accurate enough depends on the task. T3 says no, T1/T2 say mostly yes.
Gemma 3 12B keeps improving its T3 result each run. The knowledge is there. The schema precision isn't. If that can be addressed with a better prompt, it becomes interesting. But at 7 tok/s it will never be a voice model on this hardware.
Claude Haiku 4.5 remains the benchmark. 6 seconds for a 1,400-token topology. Sub-2 seconds for a spoken response. No local model touches it on latency.
Part 4: a writing benchmark. Session log summarization. Mistral Nemo versus Llama 3.1 8B on tasks that don't require structural precision. A different evaluation axis entirely.
The Right Tool is a field series on local LLM deployment in a live network lab. Part 1 established the baseline. Part 2 corrected the test design. Part 3 completed the GPU characterization. Part 4 covers a different class of task.